Comparison · 4 min read
Before You Switch WhatsApp Tools, Read the Reporting

PostEngage does not ship WhatsApp, so we cannot be the alternative you came for, and there is no head-to-head hiding further down the page.
There is a criterion that almost nobody leads with, though, and it deserves to be higher up the list: what the tool can tell you about what happened, and whether any of it helps you make a decision.
Most dashboards measure the tool, not the business
Open a reporting screen in this category and you will usually find messages sent, conversations opened, contacts added, automation triggers fired. Big numbers, going up.
All of those are measurements of the software's activity. None of them is a measurement of your business, and the gap between the two is where a lot of budget quietly goes. Sends going up is what a tool does when you pay it more.
Counts the tool
Counts the outcome
The five reports worth having
Ask a vendor to show you these on real data during a trial rather than on a marketing screenshot.
- Unanswered conversations by age. The single most valuable view in a shared inbox and the one most often missing. Not how many you answered — which ones you did not.
- What was refused, and why. If the tool declined to send something, that is an event with a cause. Aggregated over a week, refusal reasons tell you what your automations are actually bad at.
- Which trigger did nothing. Every setup accumulates automations that no longer fire. Without a report, they persist for years and one of them will eventually fire on stale wording.
- Where humans took over. The list of conversations the automation started and a person finished is a ranked list of what to automate properly next, generated for free.
- Cost attributed to something. A total is a bill. A total broken down by what caused it is a decision. Ask whether Meta's charge and the vendor's charge can be seen separately — the metering question covers why that matters.
The most useful report in any inbox tool is a list of people who did not get a reply. Almost nobody builds it.
One report, read weekly, beats a wall of charts
The practical failure is not that reporting is missing. It is that nobody looks at it, because a screen with fourteen tiles on it has no obvious entry point and so it becomes decoration.
Pick one view and put a recurring half hour against it. For most small businesses the right one is the list of conversations nobody answered, read on a Monday. It produces an action every single time, which is more than can be said for a chart of messages sent.
Export beats dashboards
A pretty dashboard answers the questions the vendor anticipated. It cannot answer yours.
So the more important question is whether the underlying rows leave the building: can you export conversations, refusals and costs as data, on demand, without a support request? Anybody with a spreadsheet can then ask a question nobody designed a chart for.
This overlaps with the exit question — which has its own page — but the motivation is different. Export as an exit is insurance. Export as reporting is something you use every month.
The numbers to be suspicious of
Two categories, and both are common in this market.
The first is any benchmark presented without a source: read rates, response rates, conversion multiples, "businesses like yours see". Ask where the number came from, over what period, across how many accounts. Often the honest answer is that it came from a deck.
The second is any rate calculated on a base the tool chose. A response rate is a fraction, and vendors differ on what goes in the denominator. Two tools can report very different rates on identical behaviour, which is why comparing them across vendors is a category error.
What we report, and what we do not
PostEngage runs on Instagram only: comments and DMs, official Graph API, a seven-day comment window, a twenty-four-hour messaging window restarted only by the other person's message.
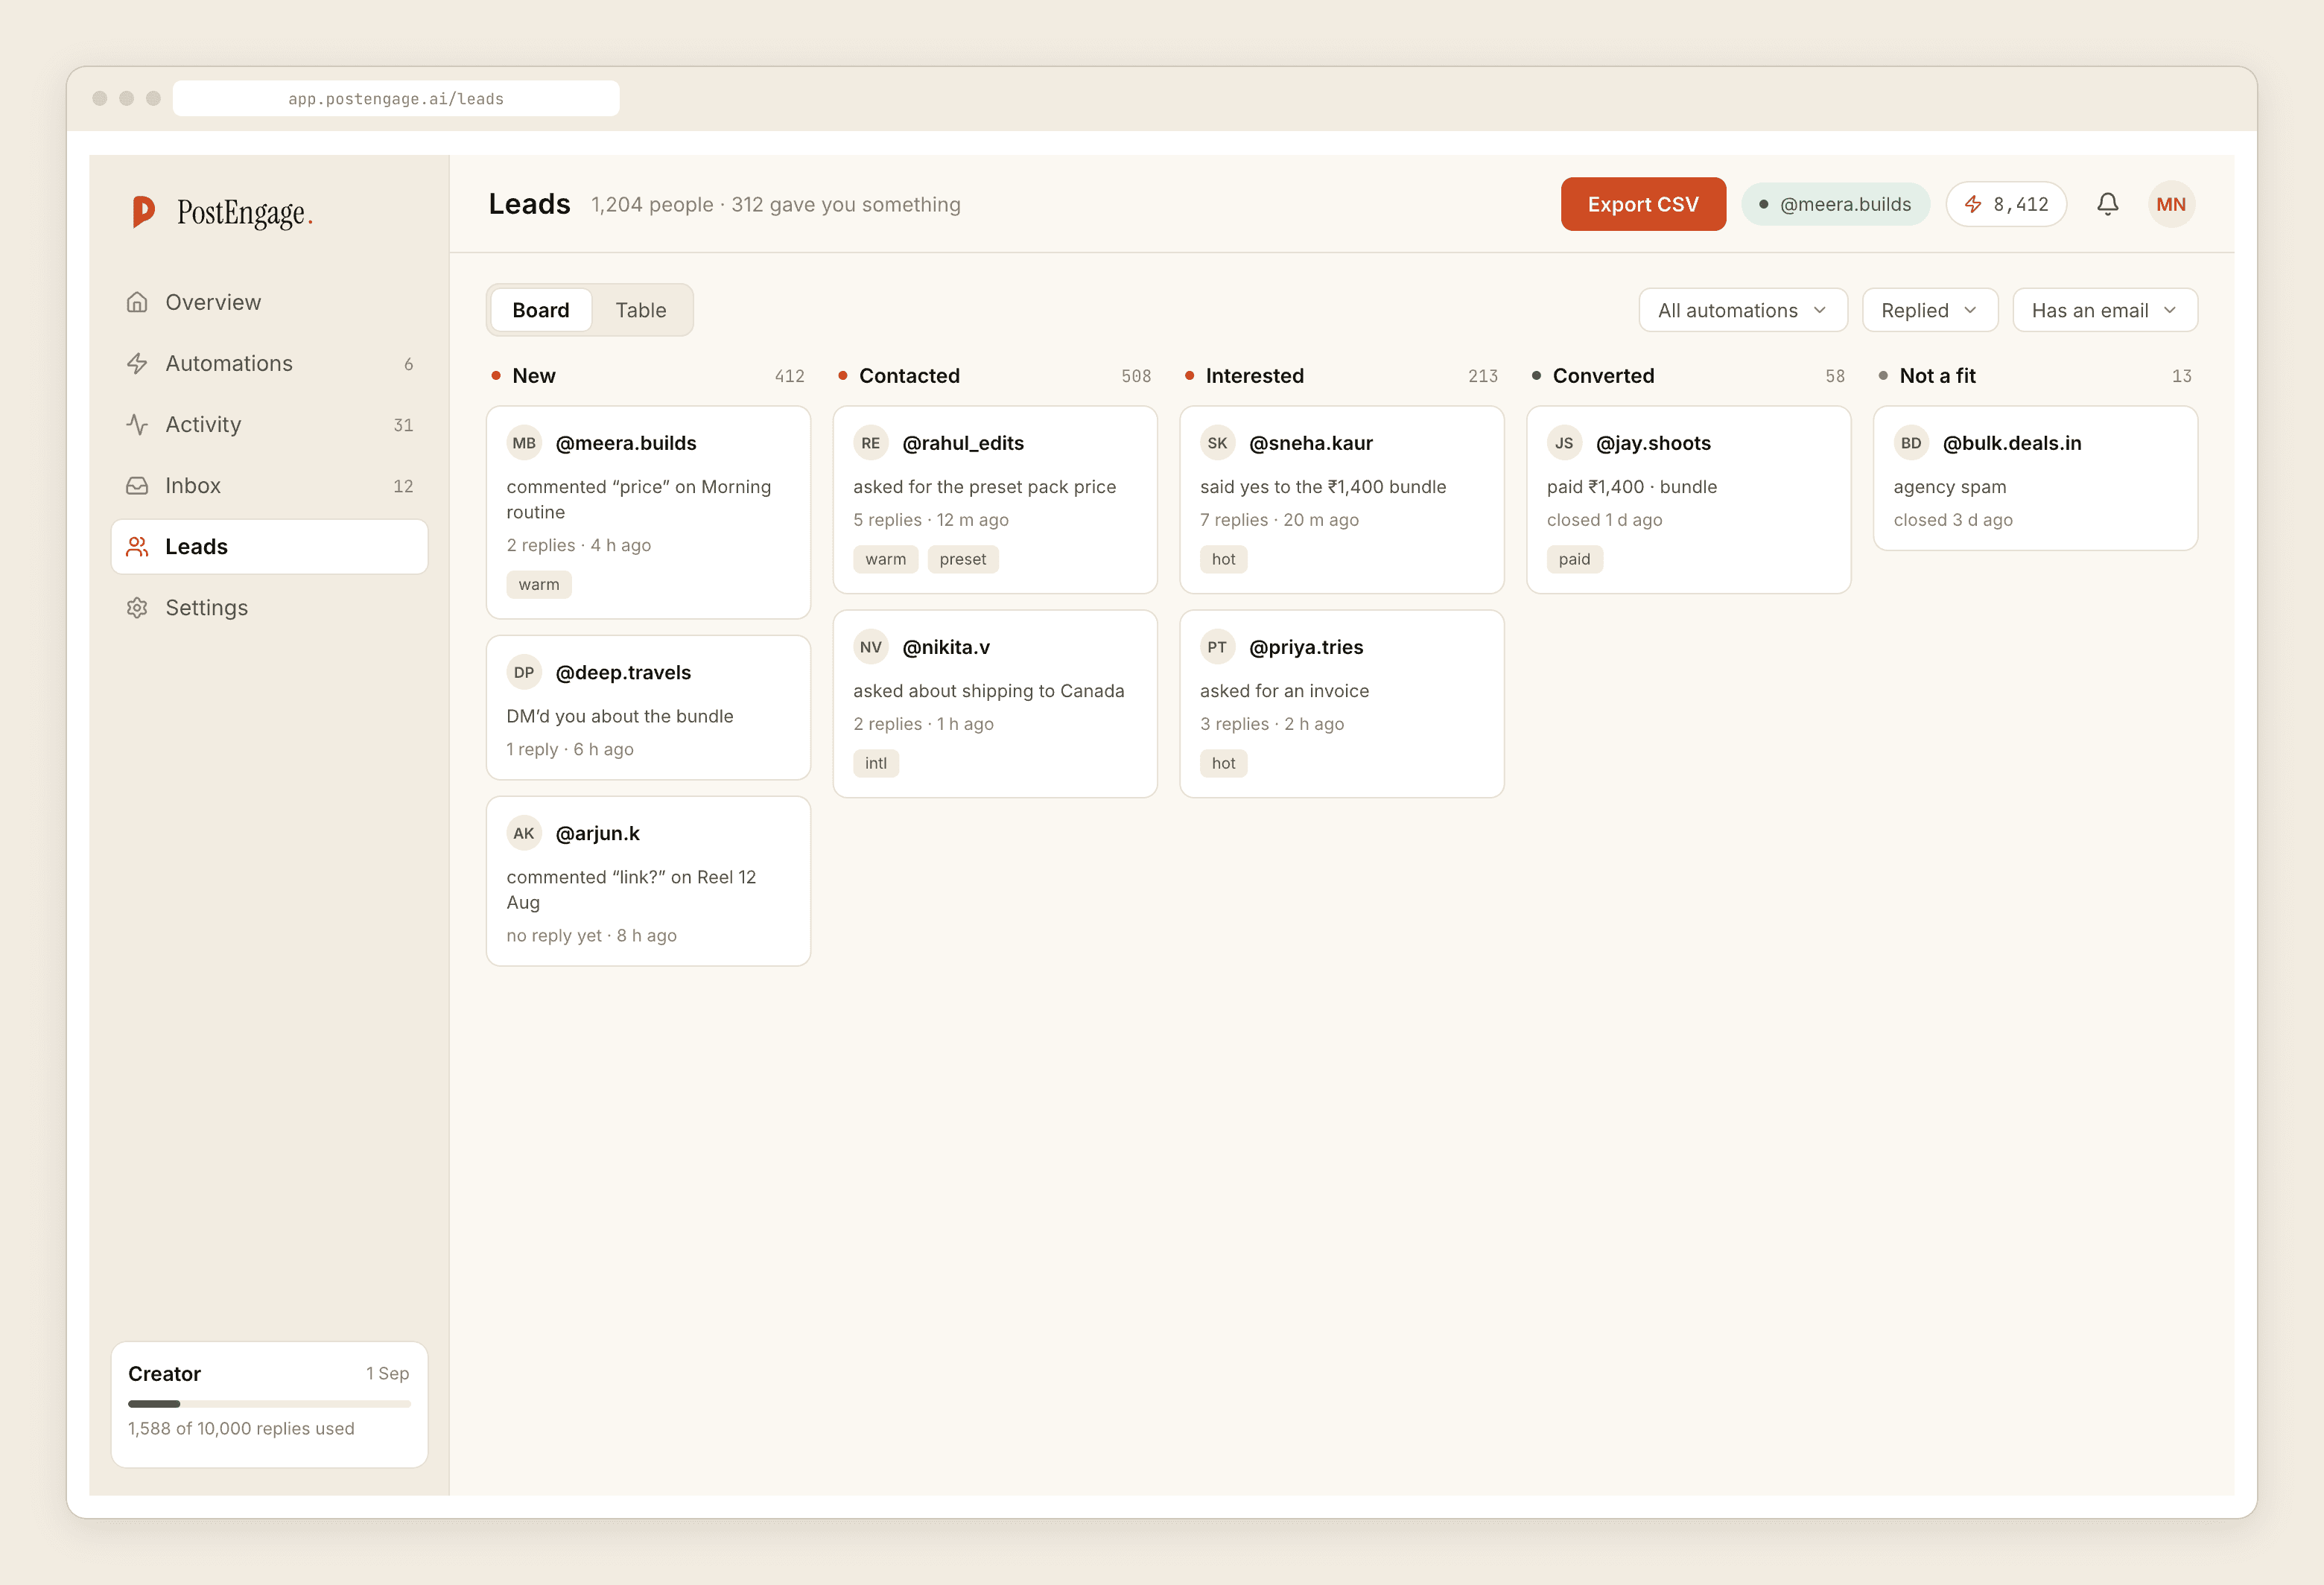
There is no analytics product here. What exists is an activity record of what was sent, what was blocked and the named check that blocked it, plus leads that export as CSV. That is closer to a log than a dashboard, and for a small account a log is more useful — but if you need attribution across campaigns, we do not have it and the self-review lists that among the gaps.
Templated replies are free and unlimited, credits move only when the model writes something new, the free tier is 100 credits with no card, and packs start at ₹499.