Playbooks · 5 min read
There Is No Dashboard. Read the Refusal Log Instead

We do not have an analytics product. No reach charts, no engagement graphs, no funnel visualisation, no conversion rate, no attribution model, no weekly digest telling you your numbers are up. If you were looking for a marketing dashboard, this is not one and will not become one by reading further.
What exists is two screens of operational data. Activity, which records every reply and every refusal with the reason it was refused. And Leads, which is the list of people who raised a hand and what they said. That is a narrower thing than a dashboard, and it happens to support better decisions, because it is about the machine you are running rather than about a number you cannot act on.
Activity is a log of refusals, and that is the good part
Every reply passes ten checks in a fixed order — kill_switch, connection, takeover, window, dedupe, cooldown, quiet_hours, rate_budget, credits, content_safety — and a reply that fails one is not sent. The reason is written down.
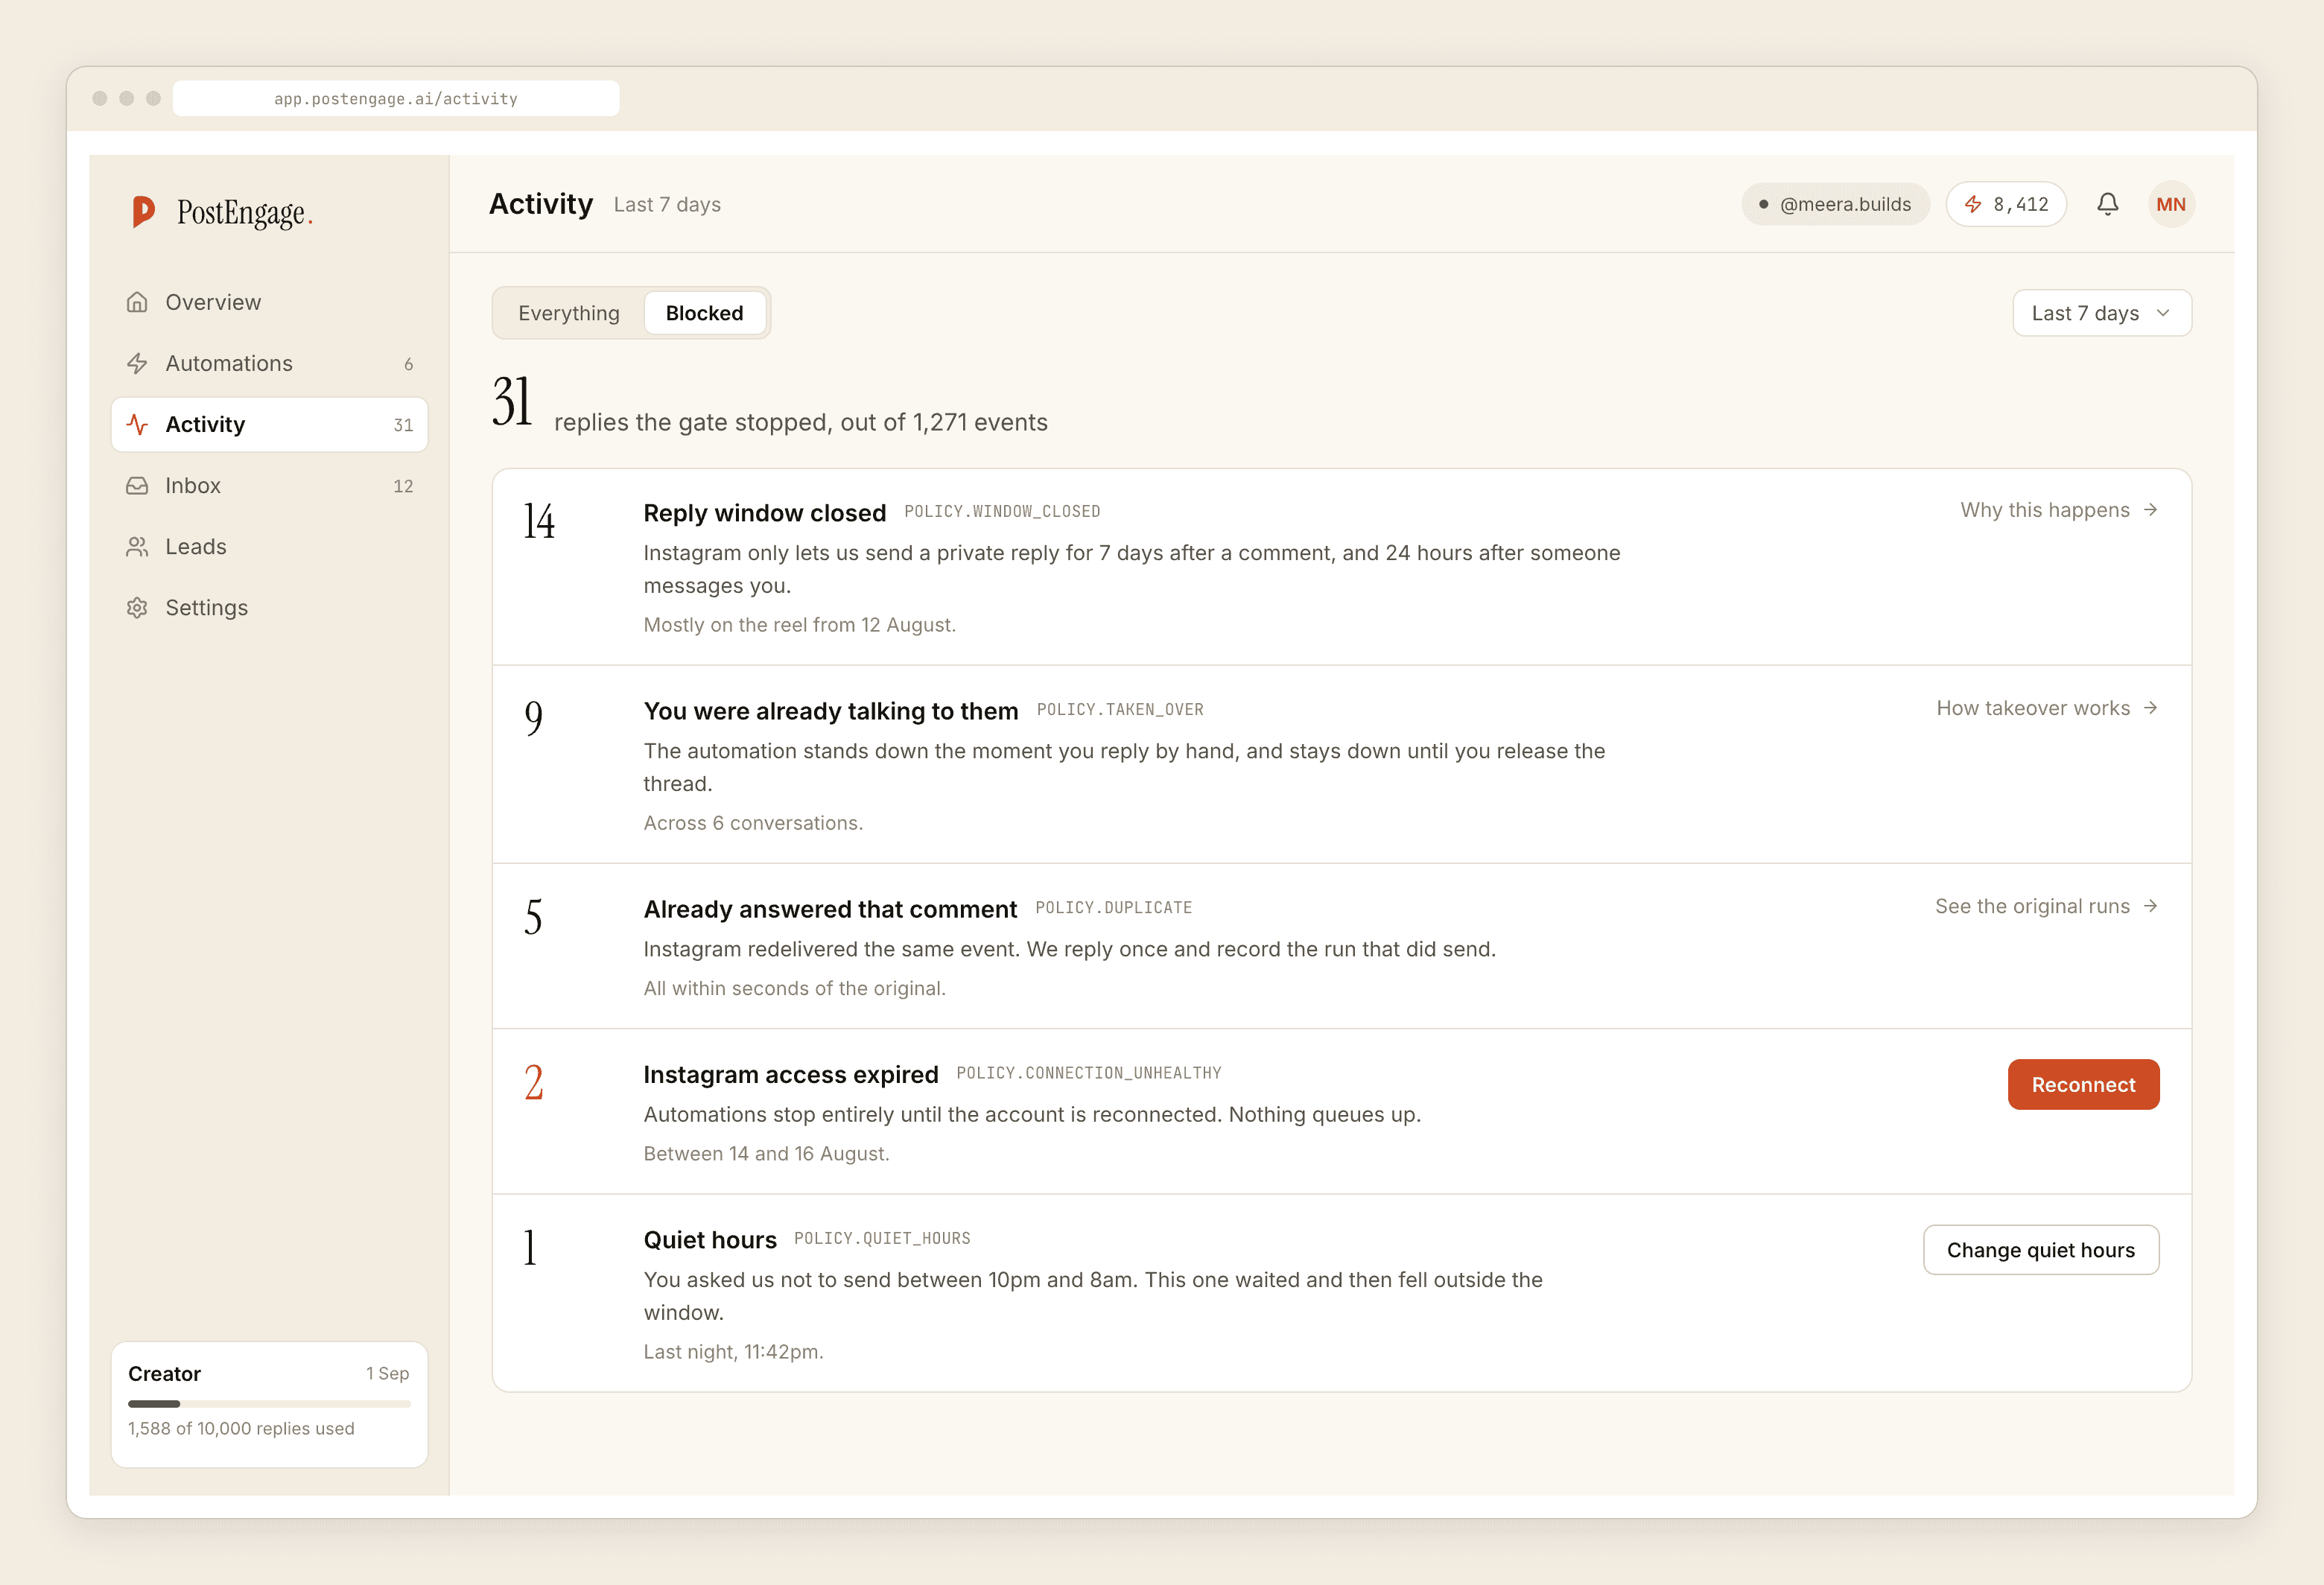
Most people open Activity when something is broken. The better habit is opening it when nothing is, because the pattern of refusals is a description of your setup that you did not write.
The check that fires most often is telling you something true about your automation, and it is rarely the thing you would have guessed.
What each pattern actually means
Read the dominant refusal, then make the corresponding change. The mapping is unglamorous and it is nearly always right.
- Mostly
window. Your trigger is sitting on posts that have aged out. Comments have seven days, DMs twenty-four hours from the person's last message. If an old evergreen Reel is generating blocked replies, either accept it or move the automation to what you are currently posting. - Mostly
dedupe. Two rules overlap, or the same people keep commenting the same keyword. Nobody gets the same reply twice for the same trigger, which is correct, but a lot of dedupe blocks means your keyword lists want tightening rather than your customers wanting more messages. - Mostly
takeover. Someone on your team is replying by hand and the automation is standing down, which is exactly right. If this is heavy, the automation is not answering the question people are actually asking, and the fix is in the reply text. - Mostly
quiet_hoursorcooldown. Working as intended, unless the volume surprises you — in which case your audience is active at hours you did not plan for, which is a real finding about your audience. - Any
content_safety. Read every one of these individually. It is the last check before the send and the only one about what the words actually are. - Any
connection. Stop and fix immediately. A revoked or broken token means nothing is going out at all, and this is the only refusal that is an outage rather than a decision.
Leads is a keyword report in disguise
The second screen is a list of people. It is also, if you squint, the only performance data in the product that is worth anything.
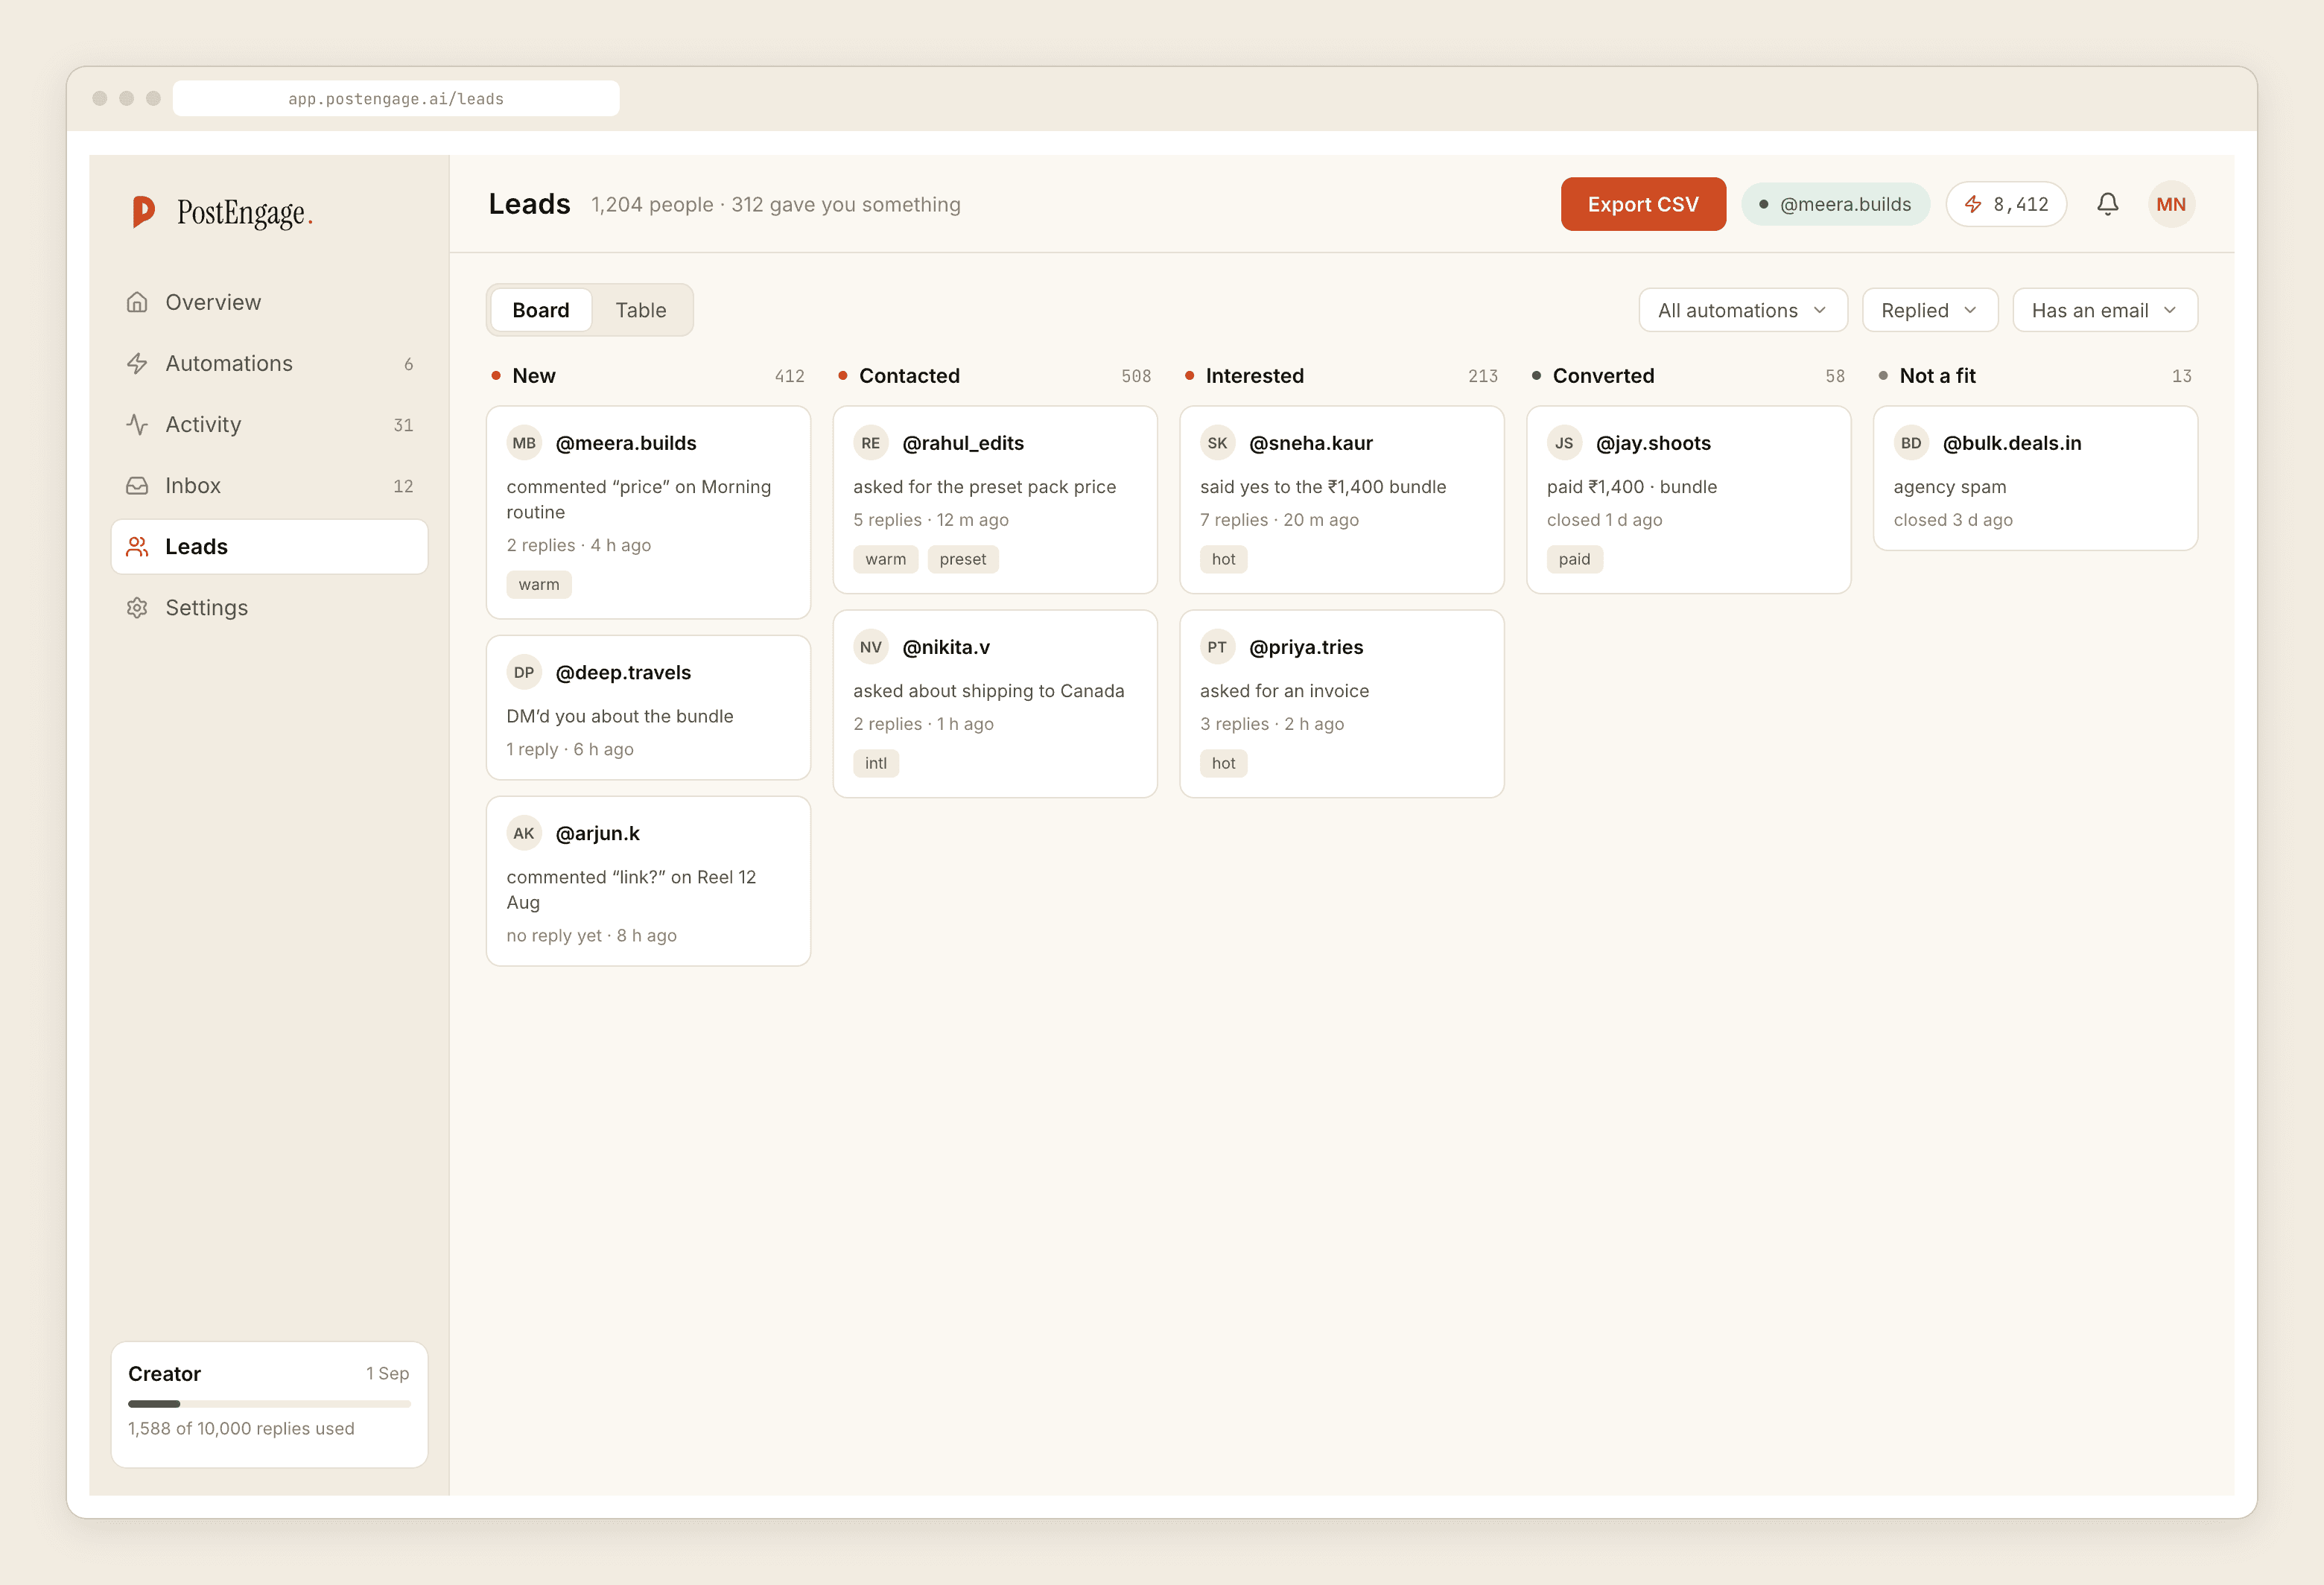
Every lead carries the post it came from and the keyword that matched. Group them mentally by keyword and you learn which call-to-action produces people who follow through, as opposed to which post got the most comments. Those are different posts more often than not. A Reel that pulled a thousand "🔥" comments and four leads told you something; a carousel that pulled sixty comments and thirty leads told you something more useful.
The decision this supports is concrete: change the line in your caption. If "PRICE" outperforms "INFO" for you, write "PRICE" in the next caption. That is a data-driven decision made from data you actually have.
What you cannot conclude, and please do not try
Being clear about this is the point of the post.
You cannot get reach, impressions or follower growth from these screens — that is Instagram's own Insights and it is where you should look for it. You cannot compute a conversion rate, because the denominator lives on Instagram and the numerator stops at the lead. You cannot attribute revenue, because nothing here knows what happened after the person left. You cannot compare yourself to a benchmark, because there is no benchmark here and any figure a vendor quotes you for "average DM performance" was made up by somebody's marketing team.
If you want those things, use Instagram Insights alongside this, and keep the two questions separate: how is my content doing is one product's job, is my automation behaving is another's.
A twenty-minute weekly review
Enough to catch everything that matters, and short enough to actually happen.
Open Activity and find the most common refusal. Ask whether it represents the system protecting you or the system misconfigured, and change one thing if it is the second. Read every content_safety block. Then open Leads, group by trigger keyword, and note which one is producing people who reply when you write back. Take that word into next week's captions.
That is it. Twenty minutes, two screens, and a change you can name — which beats a dashboard that produces a number and no verb.
If the refusals are what brought you here, the troubleshooting angle covers what platform enforcement looks like when it starts, and what counts as a hot lead will change which rows in that list you bother acting on.