Playbooks · 5 min read
The E-commerce Case Study We Are Not Going to Invent

This is not a case study. There is no real brand behind it, no customer who agreed to be written about, and not a single measured result anywhere below. The thirty-day run described here is a worked example — a plausible shape of what a store does, invented for illustration and labelled as such — and every number in it is one you would fill in from your own account, not one we are reporting.
That distinction is worth being tedious about, because the genre this post belongs to is almost entirely fabricated. A named brand, a round lead count, a percentage lift, a testimonial in italics. Those posts are easy to write and impossible to verify, and the numbers in them are usually the writer's estimate of what sounds impressive.
What follows instead: the run, described as a sequence of decisions, and the measurement plan that would tell you whether it worked.
The hypothetical: a thirty-day run at a small apparel store
Take a store selling kurtas and co-ord sets, posting a few Reels a week, with an inbox handled by the founder between other things. Entirely invented, chosen because it is the most common shape we get asked about.
- Days one to three. Connect the account. Build one automation on the best-performing product Reel, triggered on the word already appearing in its comments. Templates only, model off. Test on self. Go live on that one post.
- Days four to ten. Read Activity daily. Widen the keyword list to catch the spellings the trigger missed. Add negative keywords after the first complaint gets a cheerful reply.
- Days eleven to eighteen. Add a second automation on a different product. Turn on generated replies for the questions no template fits — mostly fit queries with the customer's own measurements in them.
- Days nineteen to twenty-five. Add the follow-up on stalled threads, several hours out, one message only, quiet hours on.
- Days twenty-six to thirty. Export leads to CSV, load them into whatever sends the store email, and stop changing settings.
Nothing in that sequence is remarkable and that is the point. The interesting question is not what the store did. It is how it would know whether any of it mattered.
The six numbers, and where each one comes from
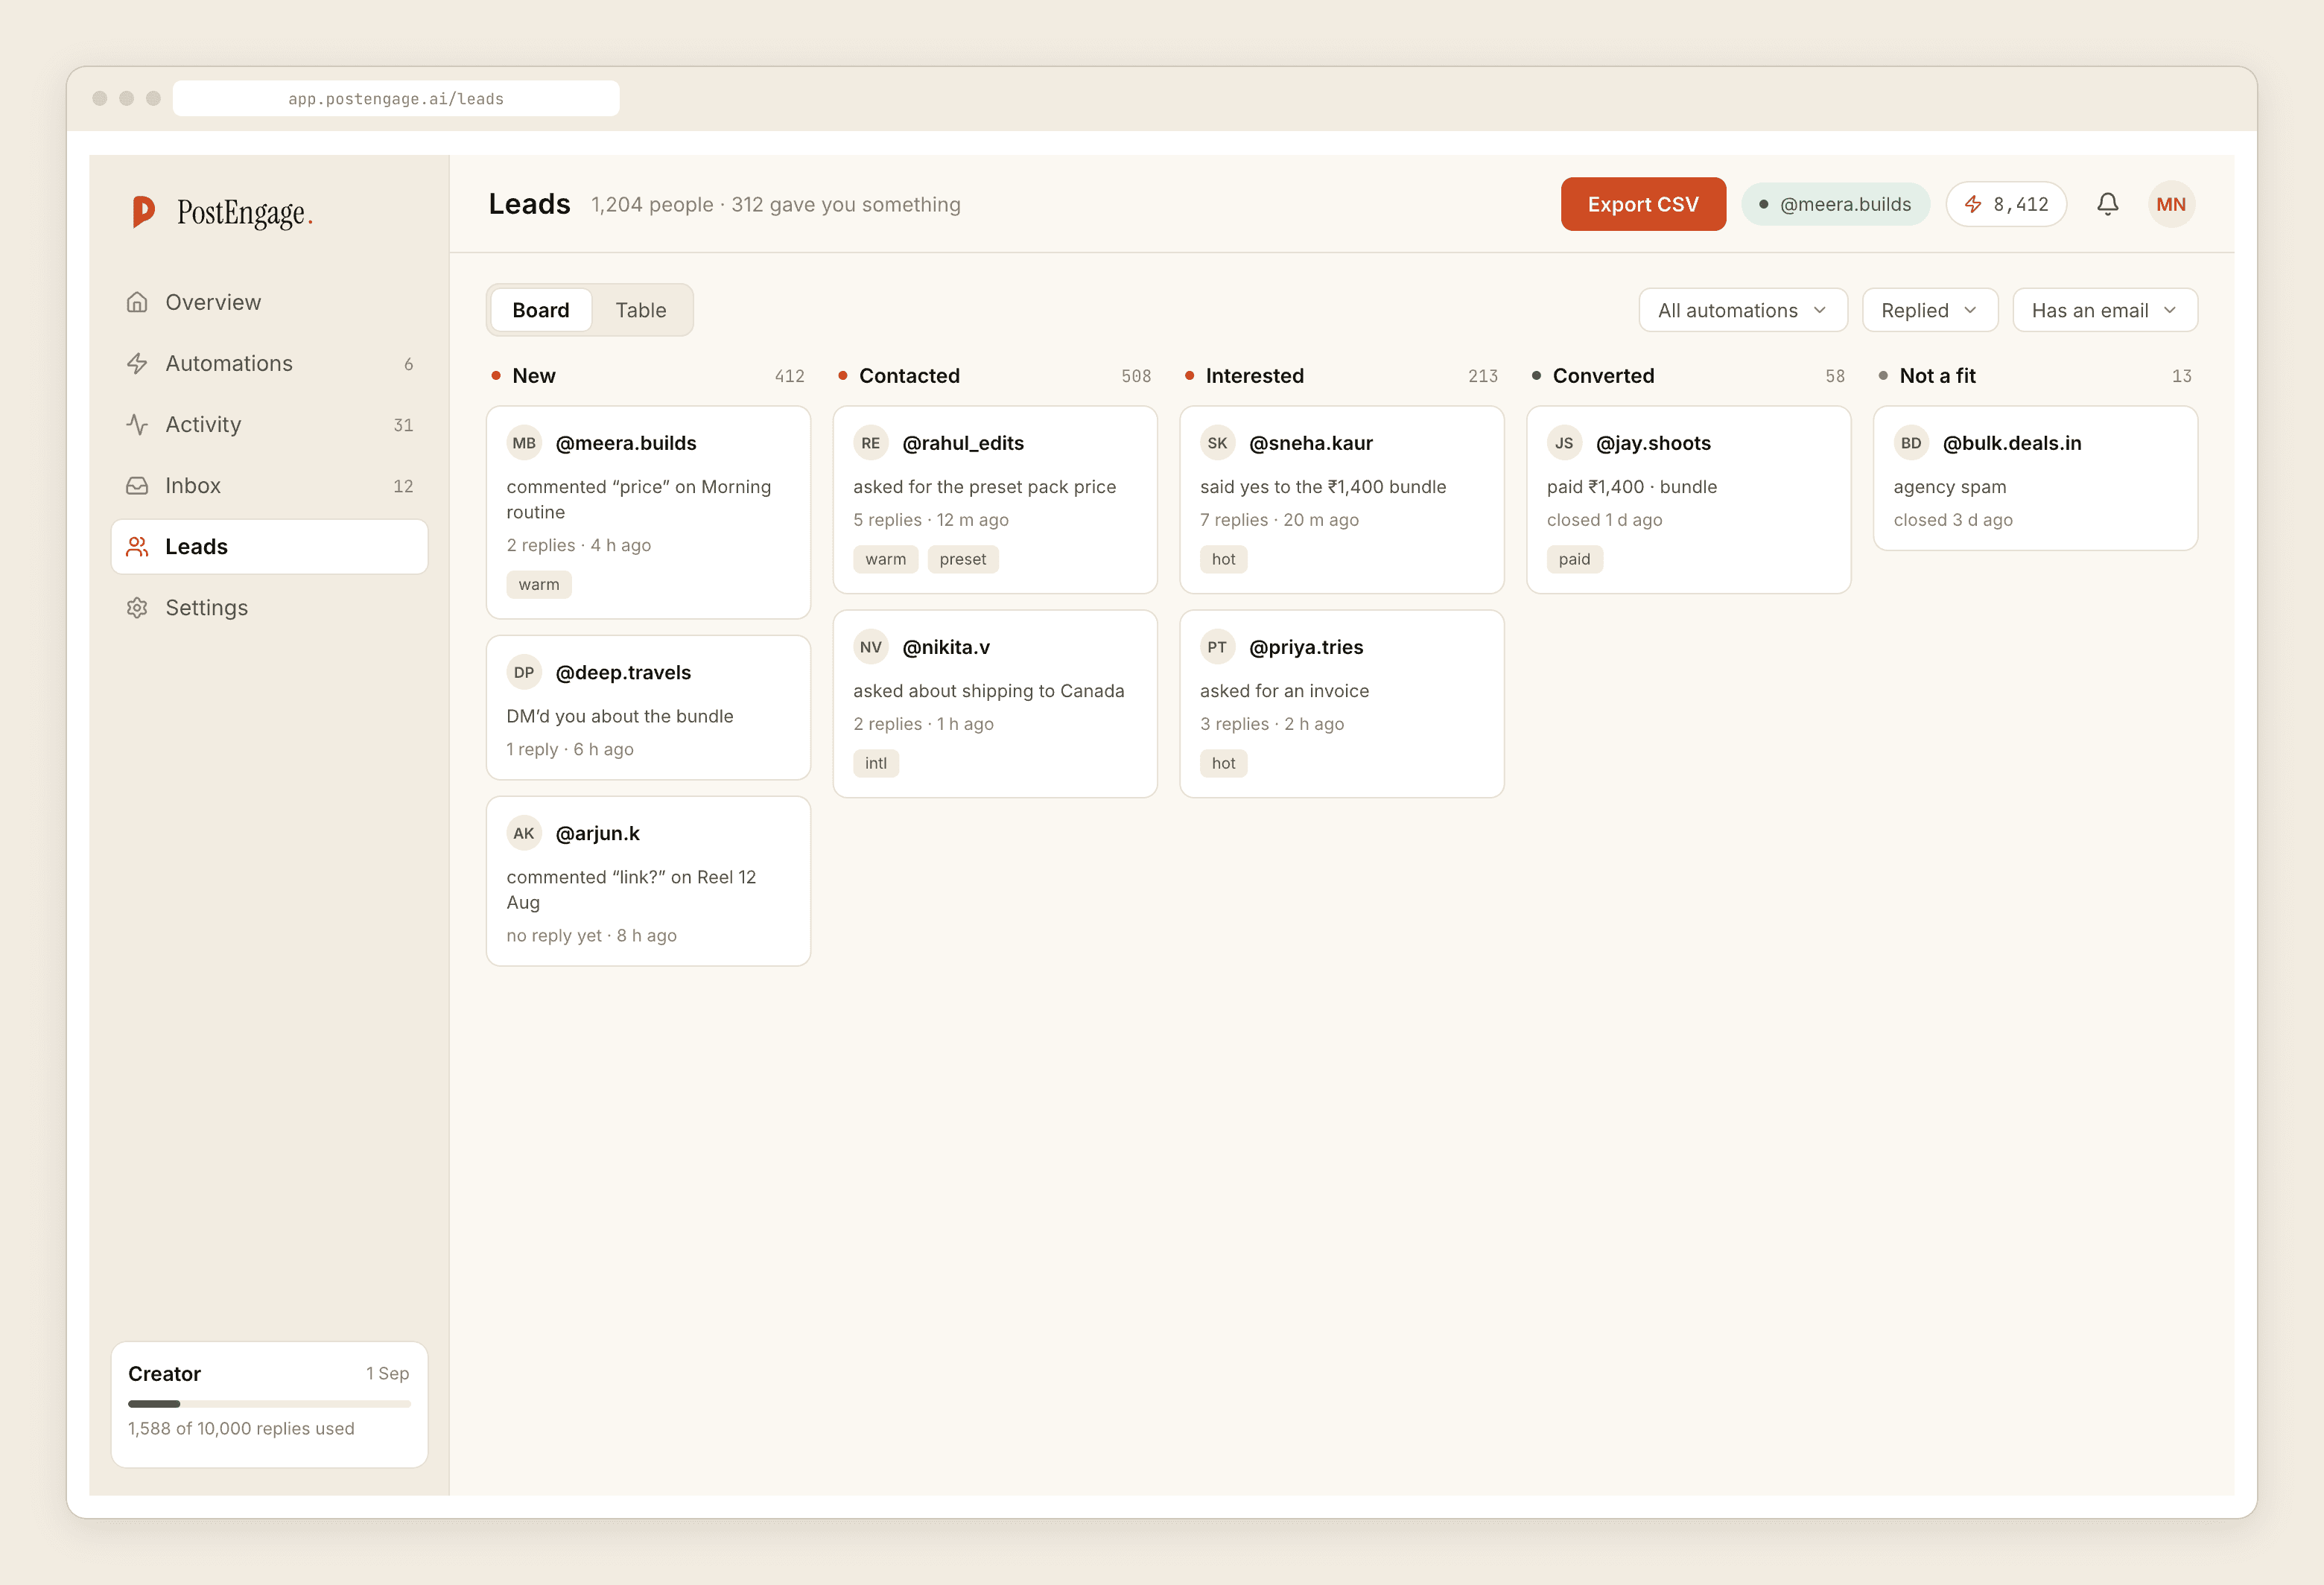
One: leads captured, split by keyword. Not a vanity total. The split is the useful part, because it tells you which product generated interest rather than which post generated views. Read it as a merchandising report.
Two: the share of first replies sent within a few minutes. This is the thing automation actually changes. It should move sharply in week one and then stay flat. If it does not move at all, your triggers are not matching what people type.
Three: replies that got a reply back. The single most important number in the set, and the one nobody tracks. Every reply from a customer restarts your twenty-four hour window, so a thread that answers back is the only asset a DM automation produces. If this is low, the problem is your first message — usually because it ends with a link instead of a question.
Four: threads a human took over. Should be small, and should be the hard ones. A large number means you are answering by hand faster than the automation, which means it is set too wide.
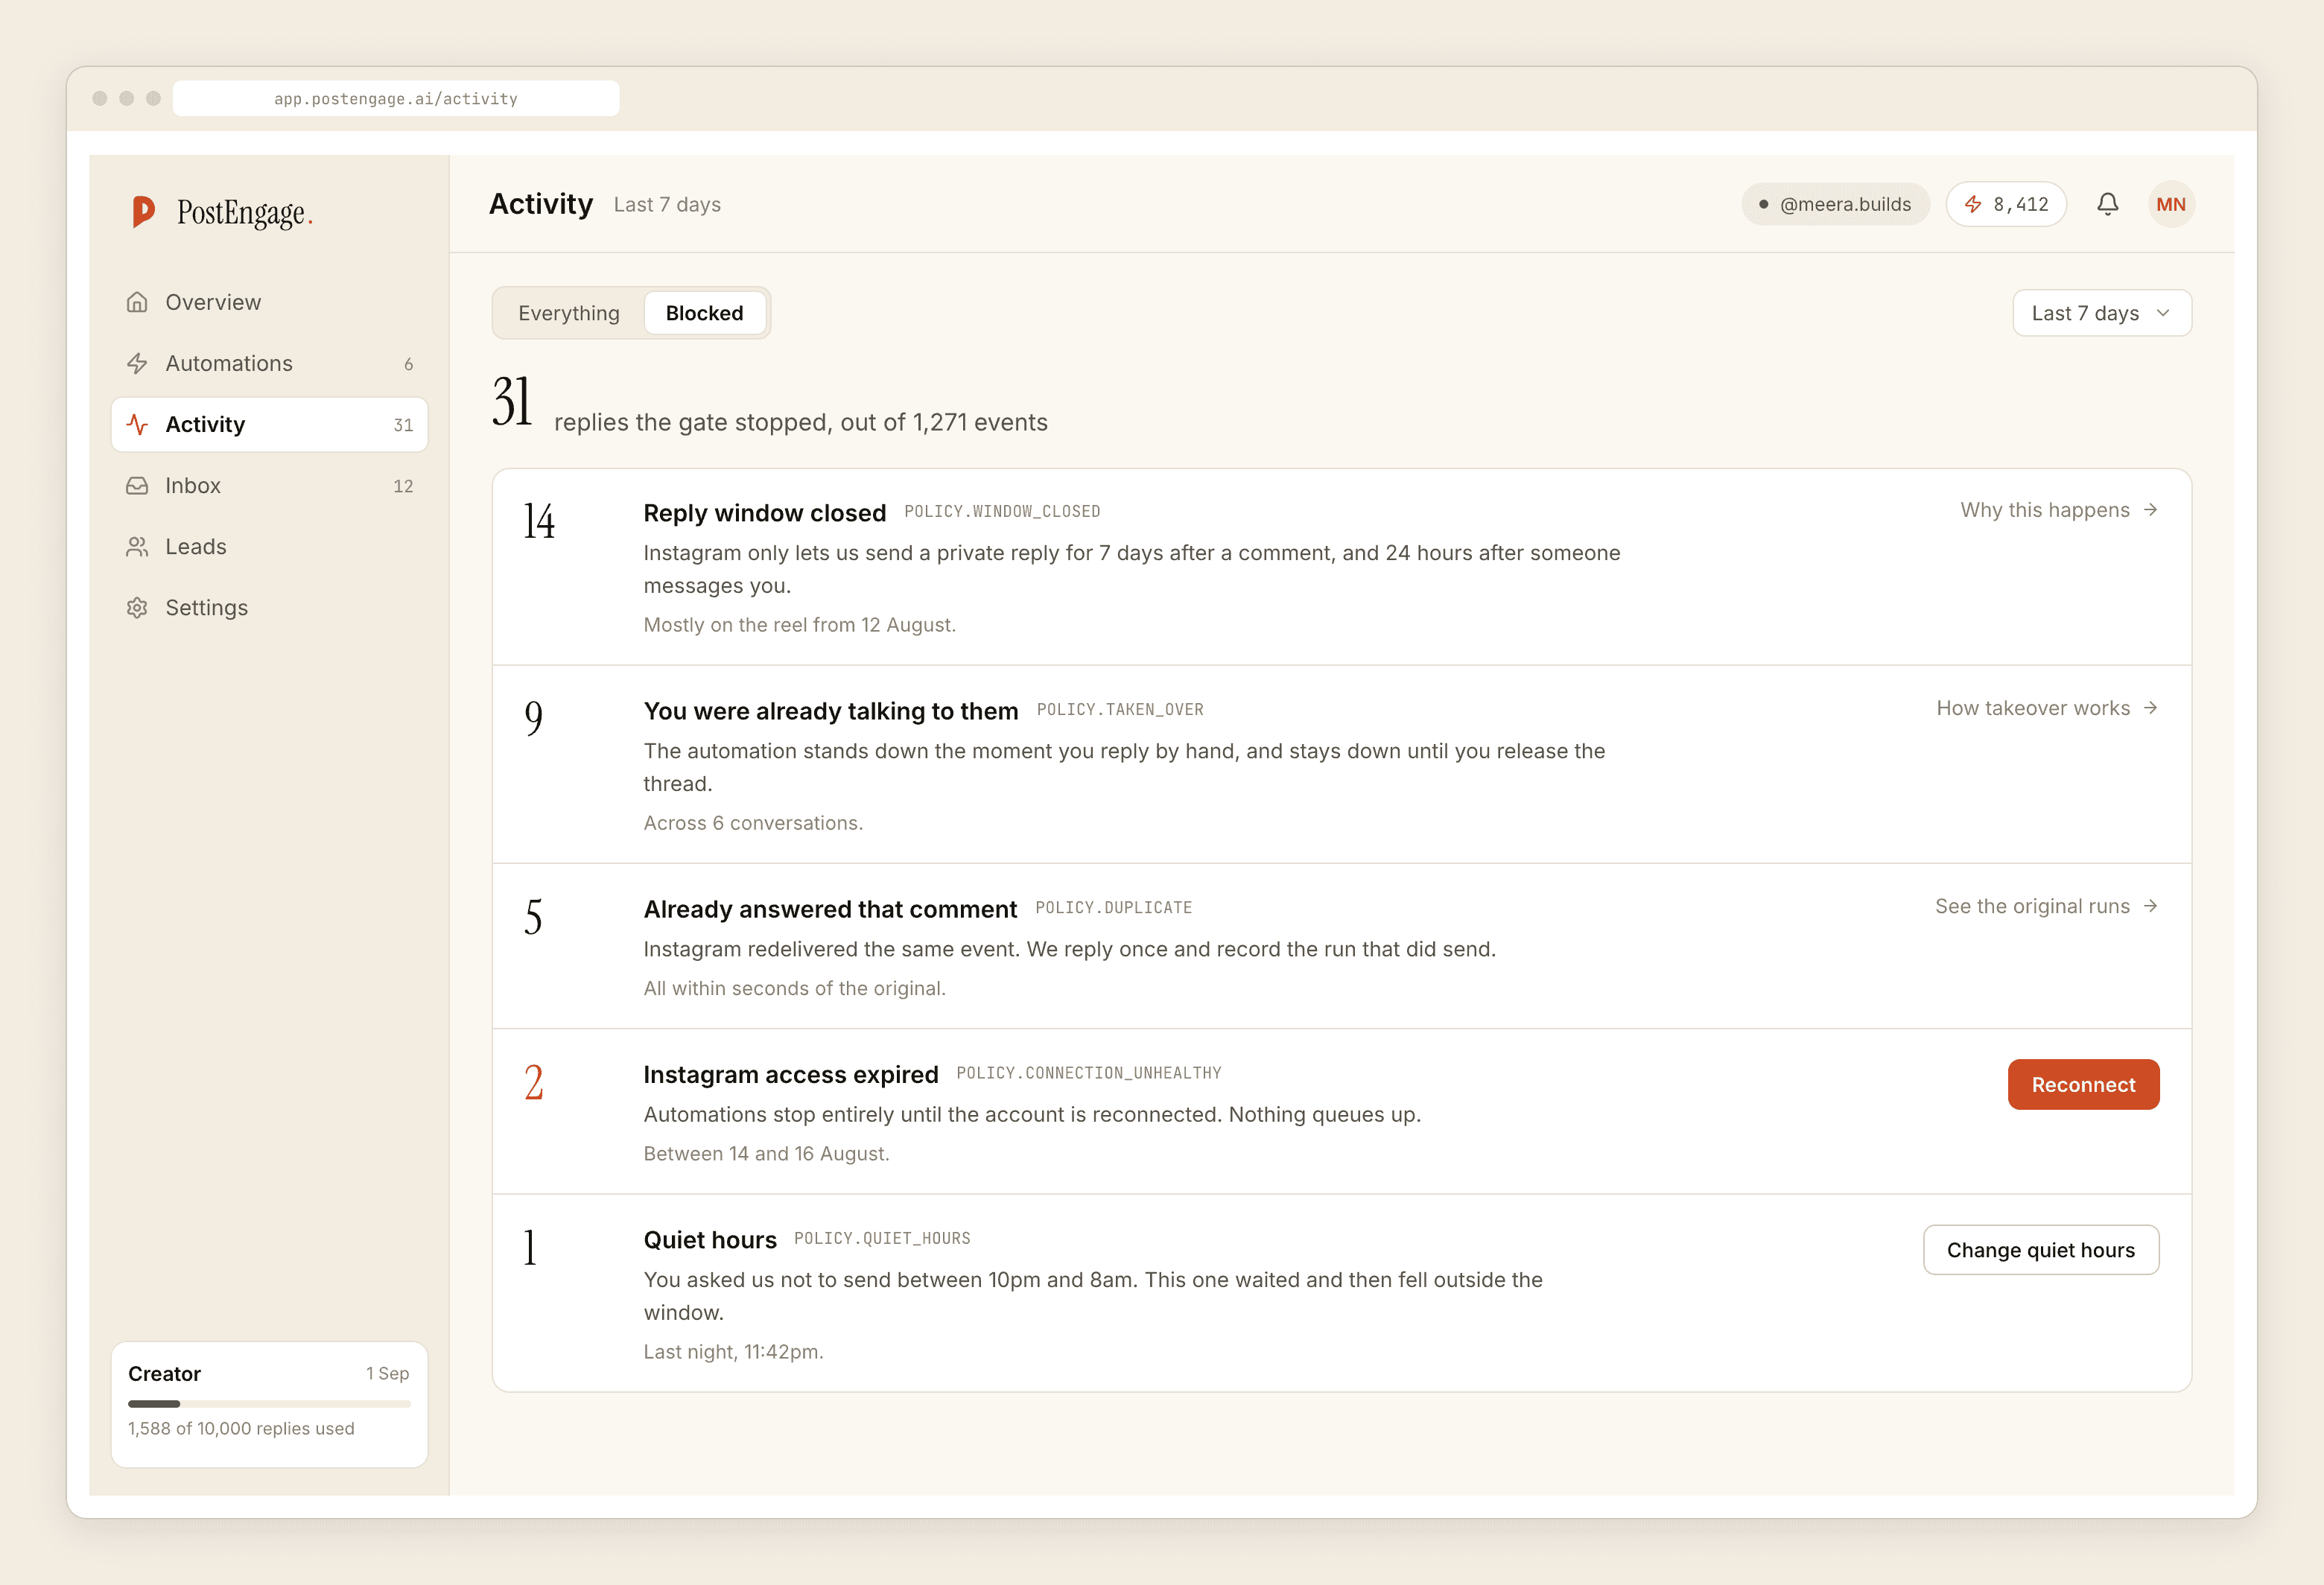
Five: blocked sends you disagreed with. Read the blocked list weekly and count the rows where you thought "that should have gone out". That count is your quality signal.
Six: credits spent. Divided by leads, it tells you the cost of the part that is not free. Templated replies are unlimited and cost nothing, so this number is only about the questions no template anticipated. If it is climbing, the fix is a new template, not a cheaper plan.
The number we deliberately left out
Revenue attributed to Instagram DMs.
You can put it in a spreadsheet. You cannot defend it. A customer asks a price in a DM on Tuesday, sees a story on Thursday, buys from a Google search on Saturday, and every tool in the chain will claim that sale. The DM genuinely helped. It did not do it alone, and any post telling you it produced a specific lift is describing a model, not a measurement.
Why the numbers would not transfer anyway
Suppose we did have a real store with real figures. It would still be close to useless to you, because the variables that dominate are not the ones a case study reports.
What the case study would tell you
What actually decided the outcome
A store selling a well-priced product to an engaged audience will produce impressive numbers with a mediocre setup. A store with a pricing problem will produce disappointing ones with a perfect setup, faster than before, because speed gets you to the objection sooner rather than removing it.
A case study measures somebody else's product-market fit and reports it as your expected result.
What to do with the next thirty days
Run the sequence at the top, or a version of it. Write down the six numbers at day zero, even roughly, because the version you reconstruct later is always flattering. Change one thing at a time and leave a week between changes.
At day thirty you will have something better than a case study: a before and after from your own account, on your own products, with your own customers, which is the only comparison that predicts anything.
If you are at the very start of that, the first hundred leads have a predictable shape and it is worth knowing what normal looks like. For the wider scope of what automation does and does not do for a store, start with the overview, and if the leads list gets large enough that reading it stops being practical, sorting it by intent is the next problem rather than the first one.